

How Body Scan Data Helps Brands Understand Real Customer Measurements
Quick Answer
Body scan data helps apparel brands understand customers by showing how body dimensions, proportions, and shapes are actually distributed across a target population—not simply what an “average” customer looks like. A sufficiently relevant anthropometric dataset can reveal patterns that conventional size charts may hide: customers with similar bust measurements but different waist or hip proportions, people who repeatedly fall between existing size combinations, body shapes that are poorly represented by current fit models, or size ranges that cover some customer groups better than others.
This does not mean every difference should become a new clothing size. Ready-to-wear sizing is fundamentally a grouping problem. Brands must decide which body dimensions matter most for a product category, how measurement intervals are defined, how many sizes are commercially practical, and how patterns should accommodate variation within each size. The strategic value of 3D body scan data therefore lies in moving sizing decisions from assumptions about customers toward measurable evidence about the population the brand intends to fit.
From Individual Body Scans to Population-Level Insight
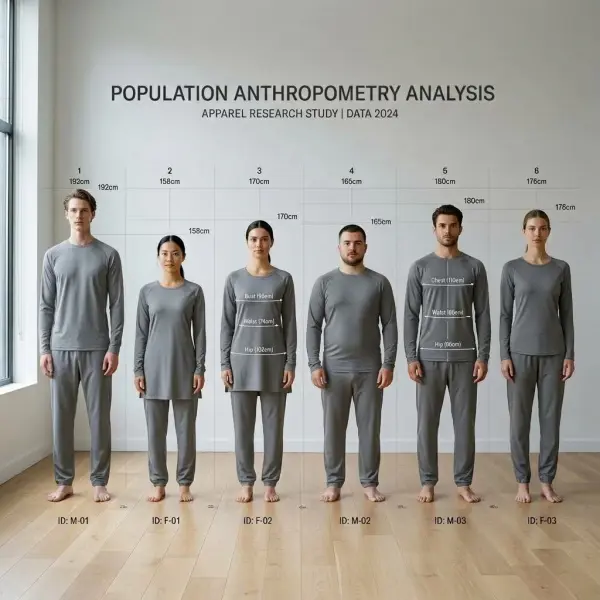
A single 3D body scan describes one person. A collection of properly gathered scans can describe something much more useful for a fashion brand: the distribution of body dimensions and shapes across a customer population. That shift—from individual measurement to population analysis—is what makes body scanning particularly valuable for ready-to-wear sizing.
A dataset might contain measurements such as stature, bust or chest girth, waist girth, hip girth, inseam-related dimensions, shoulder dimensions, torso lengths, widths, depths, and many other variables. Depending on the scanning system, researchers may also retain three-dimensional surface geometry that allows body shape to be studied beyond conventional linear measurements. The objective is not simply to calculate an average for each measurement. For clothing sizing, brands need to understand how measurements occur together. A woman with a 96 cm bust may have a relatively narrow waist and fuller hip, a more balanced torso, or a larger waist relative to her bust and hip. Treating those customers as equivalent because one circumference matches can conceal fit differences that matter to pattern development.
International sizing methodology reflects this population-level approach. ISO 8559-3 describes the use of statistical analysis of body-dimension data to establish body measurement tables and intervals for ready-to-wear clothing. It also notes that body shape and proportions can differ significantly within targeted populations. ISO 8559-3 methodology for body measurement tables
Why Averages Are Not Enough for Apparel Sizing
An average body is mathematically useful, but it can be misleading when treated as the body a fashion collection should fit. Suppose a customer dataset has an average waist circumference of 82 cm. That figure alone tells a technical team very little about how the population is distributed.
A large proportion of customers might cluster close to 82 cm. Alternatively, the same average could come from a much broader population containing substantial groups below 70 cm and above 95 cm. Those two populations could have the same arithmetic mean but require very different sizing decisions. Distribution matters because ready-to-wear clothing is sold in intervals.
A brand does not normally manufacture one garment for a theoretical average customer. It creates a sequence of sizes intended to cover portions of a population while keeping SKU count, inventory, grading, production, merchandising, and customer communication manageable. ISO 8559-3 specifically identifies the frequency distribution of body sizes as useful for determining which sizes apply to the bulk of a population. The same standard provides a statistical framework for constructing body measurement tables rather than relying on isolated average measurements.
This changes the question apparel teams should ask. Instead of: “What is our customer's average waist?”
a more commercially useful question is: “How are waist measurements distributed across our target customers, and how do those measurements combine with the other dimensions that determine fit for this garment?” That difference is fundamental.
What Can Brands Learn From Body Scan Data?
The most useful insights usually fall into several connected layers: dimension distribution, measurement relationships, proportion, body shape, and size-system coverage.
1. The Real Distribution of Body Measurements
Body-scan datasets allow analysts to examine the frequency of different body dimensions within a population. For example, a women's trouser brand might analyze:
- waist girth,
- hip girth,
- waist-to-hip relationship,
- crotch height,
- inside-leg length,
- thigh girth,
- lower-body shape.
The important insight is rarely a single number. It is the pattern formed by those measurements. A business may discover that its highest-volume nominal size corresponds reasonably well with customer waist measurements but represents only a narrower segment of actual hip measurements. That can help explain why one garment consistently feels tight at the hip for some customers while another group experiences excess fabric at the waist. This is where body data becomes actionable: it can identify where the current product architecture and customer population stop aligning.
2. How Measurements Correlate
Traditional size charts often imply neat relationships between dimensions. As one size increases, bust, waist, and hip measurements may all increase according to predetermined grade increments. Real bodies do not necessarily change in those perfectly synchronized steps.
Body scan data can be analyzed statistically to determine how strongly different variables are related within a target population. ISO 8559-3 itself discusses the selection of explanatory and dependent variables when constructing body measurement tables, including the use of regression-based approaches. For a brand, this can reveal whether its current assumptions are realistic. If hip girth rises differently relative to waist girth across the customer population than the company's existing size chart assumes, simply extending the current grading rule into larger sizes may preserve a mismatch rather than solve it.

3. Proportions, Not Just Circumferences
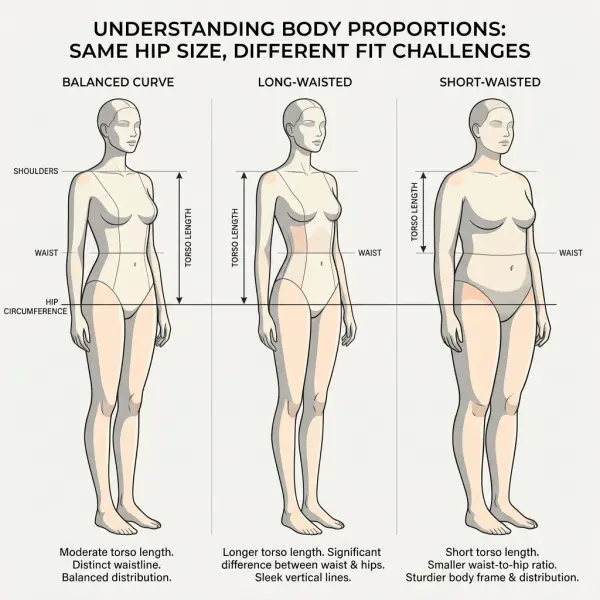
Two customers can share the same primary circumference while differing in vertical and horizontal proportions. A torso can be longer or shorter. Legs can represent a different proportion of overall height. Shoulder breadth can differ at similar chest circumference. Hip circumference can be distributed differently between width and front-to-back depth. This is one reason three-dimensional anthropometry can offer information beyond a small conventional measurement set.
Research using large-scale 3D scan datasets has demonstrated that multiple measurement variables can be combined to identify recurring body-shape patterns. One study involving thousands of adults, for example, derived multidimensional body-shape clusters from scanner measurements rather than relying on one circumference or body-mass index alone. For apparel teams, that is useful because patterns interact with geometry, not merely with measurement labels.
Body Size and Body Shape Are Related—but Not Identical
Body size describes magnitude. Body shape describes how that magnitude is distributed. The distinction is crucial for apparel fit. Two people can have similar bust, waist, and hip circumferences yet still have different three-dimensional shapes because circumference alone does not tell a pattern maker how volume is distributed around the body.
Consider a hip circumference. The same girth could result from:
- a relatively wider side-to-side silhouette;
- greater buttock projection;
- greater abdominal projection;
- a different balance between those features.
From the perspective of a tape measure, these bodies may appear surprisingly similar. From the perspective of a trouser pattern, they may not behave similarly at all.
Cornell body-scanning research using 2,488 women aged 18–35 from the SizeUSA dataset illustrates this point. Researchers analyzed lower-body characteristics including waist-to-upper-hip silhouette, upper-hip-to-full-hip silhouette, buttocks prominence, abdomen prominence, and related shape information to identify recurring lower-body groups. More recent research continues to explore data-driven body-shape classification. A 2026 study analyzing valid scans from 815 Korean women used ratios and depth-related measurements to derive multiple female shape categories, demonstrating how scan data can distinguish morphology beyond a simple size label. The population and classification method are specific to that study, so those categories should not be assumed to represent every market.
That caveat matters. A brand should not download a body-shape taxonomy developed for another population and assume that its own customers follow the same distribution.
Why Measurement Combinations Matter More Than Individual Numbers
One of the most commercially important uses of body data is identifying combinations that do not fit neatly into an existing size chart. Imagine a hypothetical womenswear brand whose size M is designed around:
Bust: 92 cm
Waist: 74 cm
Hip: 100 cm
A customer with a 92 cm bust may have an 82 cm waist rather than 74 cm. Another might have a 108 cm hip. A third may fit all three circumferences reasonably well but have substantially different torso length. Which customer is really a size M? There is no universal answer. It depends on the garment category and the brand's fit rules.
A 2025 study using 3D measurements from 677 female participants illustrates how inconsistent body-to-size mapping can become when multiple measurements are considered. Only a small portion of participants aligned consistently to the same size across the bust, waist, and hip classifications used in that specific study, while many crossed nominal size categories. The researchers also found that some participants were not adequately accommodated by the sizing scheme being tested. Those figures belong to that dataset and should not be generalized to all consumers, but the study clearly demonstrates the measurement-combination problem.
For brands, this is a more useful insight than saying simply that “people have different bodies.” Body data can help quantify where those differences occur relative to the company's actual size architecture.
Size-Chart Coverage: Which Customers Does the Current System Actually Fit?
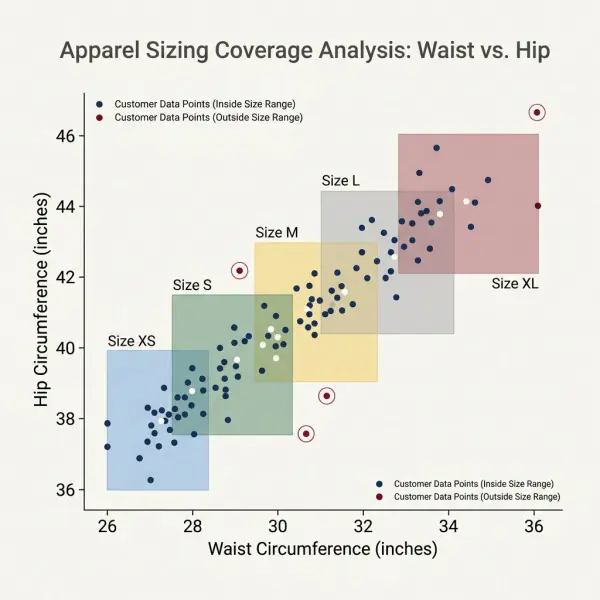
A size chart is effectively a model of a population. The question is not whether every person matches it perfectly—that would be unrealistic for most ready-to-wear systems—but how much of the intended customer population falls within the measurement combinations the system is designed to accommodate. This concept can be assessed as coverage.
ISO 8559-4:2023 specifically describes methods for calculating coverage ratios of body measurement tables against selected dimensions of a target population. The method requires a database of body dimensions for that population. ISO 8559-4 coverage ratios for clothing size tables
Conceptually, this enables a brand to ask questions such as:
- How many target customers fall within the bust-waist combinations represented by our womenswear size table?
- How does coverage change if we extend the size range?
- Would changing measurement intervals improve coverage?
- Are some body combinations still systematically outside the table?
- Does one size system cover different customer segments unevenly?
This does not mean that a customer inside a measurement interval is guaranteed perfect garment fit. Size-table coverage concerns body dimensions; garment fit still depends on the pattern, ease, fabric, construction, style, and fit preference. Nevertheless, coverage provides a much more disciplined way of evaluating a sizing system than relying only on customer anecdotes.
Why Representative Data Matters More Than a Large Dataset
A dataset can contain thousands of scans and still give a brand the wrong picture of its customers. Sample relevance is more important than raw sample size. If a brand primarily sells to women aged 45–65 but bases its pattern strategy on a scan sample dominated by university students, the analysis may be statistically precise yet commercially misaligned. The same principle applies across geography, age, sex, target market, product category, and other variables relevant to the sizing problem.
Large anthropometric surveys demonstrate why sampling is treated as a serious design issue. Size NorthAmerica, for example, scanned more than 18,000 people across the United States and Canada between 2017 and 2019 and gathered socio-demographic information alongside the body data. The project was structured as a population survey rather than simply a collection of convenient scans.
Brands do not necessarily need a national-scale study. They do need to know who is represented in the dataset. A smaller dataset containing the customers relevant to a specialized brand can sometimes be more actionable than a very large general population database.
For example, a cycling apparel company may care deeply about the body characteristics of active adult cyclists. A maternity brand has a completely different measurement problem. A school-uniform supplier needs data appropriate to children and adolescents across relevant ages. A petite womenswear specialist may deliberately serve a population that differs from the general market. “More data” and “better data” are not the same thing.
Population Data Is Not the Same as Customer Data
This distinction is easy to overlook. Population anthropometric data describes people within a defined demographic or geographic sample. Customer data describes people who actually buy, consider buying, or are strategically targeted by a particular brand. The two populations can overlap, but they are not necessarily equivalent.
Imagine a fashion brand selling primarily through premium urban stores. Its customers may differ from the national population in age distribution, location, lifestyle, income, gender mix, or product preferences. Using national anthropometric data may provide a valuable baseline. But treating it as a perfect representation of the brand's buyers can introduce another layer of assumptions. The stronger approach is to combine external anthropometric evidence with internal information where legitimately available—for example:
- customer scans;
- size selections;
- garment return reasons;
- fit feedback;
- alteration patterns;
- product-category differences;
- technical fit assessments.
Those datasets answer different questions. They should not be collapsed into one without understanding how each was collected.
How Body Scan Data Can Reveal Problems in an Existing Size Chart
A brand does not need to redesign its entire size system simply because new body data becomes available. The first use of the data can be diagnostic. A technical team can map relevant customer measurements against its existing body size chart and look for systematic mismatches.
Suppose a brand notices a high return rate for trousers in sizes 14–18. Body data might reveal that the waist-to-hip relationship embedded in the existing chart becomes increasingly unrepresentative within that section of the target customer population. That does not immediately prove that the size chart is responsible for the returns. Garment pattern, material, styling, construction tolerance, product photography, and customer size selection could also contribute. But it gives the team a testable hypothesis.
The next step might be comparing scan data with:
- actual garment measurements;
- technical specifications;
- return reasons;
- fit-session observations;
- pattern grading.
This is substantially more useful than responding to returns by randomly increasing or decreasing a garment measurement.
Scan Data Can Challenge Linear Grading Assumptions
Commercial grading converts a base pattern into a range of sizes by applying controlled dimensional changes. That process is essential for ready-to-wear manufacturing, but a grade rule is not automatically a mathematical description of how real human bodies vary. This distinction becomes especially important when brands extend an existing size range.
A company may be tempted to take a pattern originally developed for a narrow central size range and continue applying the same grading logic upward or downward. Body data can reveal whether the assumed relationships between measurements remain appropriate across those expanded ranges. For readers unfamiliar with the pattern side of the process, garment grading and apparel size ranges explains how base patterns are systematically transformed into multiple production sizes.
The key point here is that anthropometric scaling and pattern grading are related but different processes. Customers do not simply become geometrically enlarged or reduced versions of a base-size fit model.
Body Data Can Improve Fit-Form and Avatar Selection
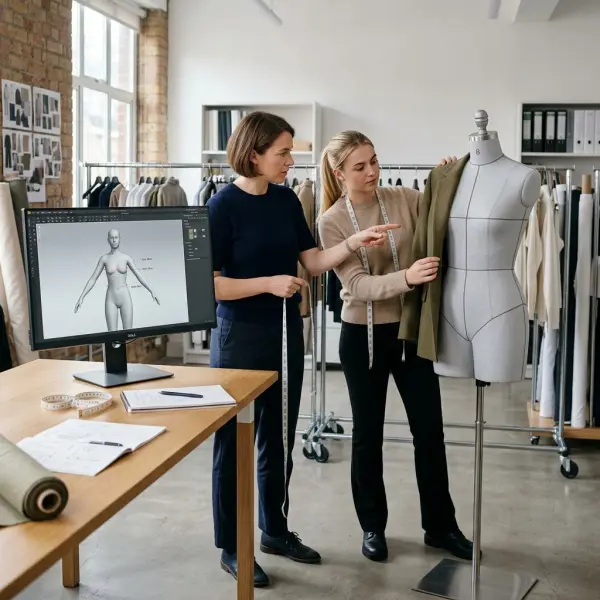
Fit forms, mannequins, and digital avatars act as physical or virtual representatives of customers during product development. If that representative body is poorly chosen, a technically consistent fitting process can still optimize the product around the wrong geometry. Body-scan datasets allow brands to evaluate whether their existing fit body sits close to meaningful portions of the target population.
The objective should not necessarily be to identify one perfect average avatar. Depending on the product range, a brand may need to understand several recurring body configurations. Cornell's work using SizeUSA data provides a practical example: lower-body shape analysis was used to identify distinct shape groups and select representative fit models within those groups.
For a fashion business, this raises useful questions:
- Does our fit model represent a common customer shape?
- Are we testing only one body geometry even though the customer base contains several important patterns?
- Would a secondary fit form expose predictable problems before production?
- Do our digital avatars correspond to the same measurement definitions used by our physical technical team?
A scan database does not answer those decisions automatically, but it can make the choices far less arbitrary.
Different Garment Categories Need Different Body Data
Not every measurement deserves equal priority for every garment. This sounds simple, but it prevents a common analytical mistake: collecting dozens of dimensions and treating all of them as equally important. The measurements controlling trouser fit differ from those controlling a fitted shirt.
For trousers, waist, hip, crotch geometry, thigh, rise, and leg-related measurements may matter strongly. For a fitted women's blouse, bust, waist, shoulder, back width, torso length, and arm-related dimensions may become more relevant. A hat, glove, bra, compression garment, workwear system, and oversized T-shirt each create different anthropometric requirements. This is also why ISO clothing-sizing methodology distinguishes primary and secondary body dimensions used for size designation rather than assuming one universal measurement combination for all products.
For brands, the operational rule is straightforward: Start with the garment and its fit problem, then determine which body variables matter. Do not start with the largest available dataset and search for something interesting to do with it.
How Brands Can Turn Body Scan Data Into Sizing Decisions
The useful path from scan data to product decision is not: scan → new size chart. Several analytical and apparel-development stages sit between them.
A practical sequence is:
1. Define the target population Specify who the product is designed for rather than treating “customers” as a universal population.
2. Define the garment category Determine which dimensions materially affect fit for that product.
3. Standardize measurement definitions Make sure scanner measurements, existing size charts, fit forms, patterns, and technical specifications refer to comparable landmarks.
4. Examine distributions Study how each relevant measurement is distributed rather than relying only on mean values.
5. Analyze measurement combinations Look at bust-waist, waist-hip, stature-inseam, chest-shoulder, or other relationships appropriate to the product.
6. Explore body-shape variation Where three-dimensional geometry matters, identify recurring shape patterns rather than assuming circumference fully explains form.
7. Map the data against the current size system Determine where customers fall within, between, or outside existing measurement intervals.
8. Evaluate coverage Measure how effectively proposed tables represent the intended population rather than assuming that adding sizes automatically solves the problem.
9. Translate findings into pattern hypotheses Decide whether evidence suggests changes to base blocks, grade rules, length options, shape options, or fit forms.
10. Validate with garments Body statistics should ultimately be tested through actual apparel development and fitting.
The last stage is essential. A mathematically elegant size table is not useful if garments built around it fail to perform on bodies.
When Should a Brand Add More Sizes—and When Should It Change Shape?
Body data can help separate two problems that are often confused. Sometimes customers are outside the current size range. In that situation, extending the range may improve coverage.
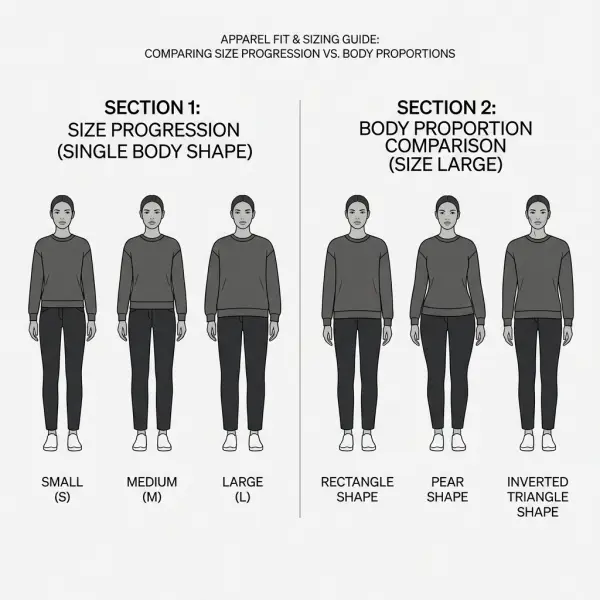
At other times, customers are technically within the size range but their proportions differ from the shape assumptions built into the pattern. Adding another nominal size may not solve that problem. For example, a trouser customer whose hip fits size 12 but whose waist corresponds more closely to size 16 may not benefit from adding size 13 or 14. The deeper issue could be the waist-to-hip relationship embedded in the pattern block.
Possible responses might include:
- a different base shape;
- a curvy-fit option;
- alternative rise or length configurations;
- revised grading relationships;
- a product specifically designed for that customer group.
Those decisions carry inventory and operational consequences, so scan data should be used to identify meaningful customer groups rather than create a separate product variation for every measurable difference. Ready-to-wear requires compression of body diversity into commercially workable choices. The aim is not perfect representation of every body. It is to make those compromises deliberately.
Why Segmentation Must Be Used Carefully
Once brands have detailed customer measurements, it becomes tempting to divide people into ever smaller body categories. Technically, modern statistical and machine-learning methods can identify clusters and classify bodies using many variables. Recent research continues to demonstrate sophisticated body-shape classification from 3D scan data. Commercial apparel, however, imposes another constraint: complexity.
Every additional fit block, length, shape category, or size can affect:
- pattern development;
- sampling;
- SKU count;
- minimum order quantities;
- inventory allocation;
- merchandising;
- warehouse operations;
- product-page communication;
- customer decision-making.
So a statistically detectable group is not automatically a commercially viable sizing segment. The relevant question is: Does this body group occur often enough, experience a meaningful fit problem, and create enough business value to justify a separate product solution? That combines anthropometric evidence with commercial judgment.
What Body Data Can—and Cannot—Tell Brands About Fit
Body scan data can describe the body extremely well when the system and protocol are appropriate. It still does not fully describe garment fit. Fit exists at the interaction between:
- the customer's body;
- the garment pattern;
- fabric properties;
- ease;
- construction;
- manufacturing tolerance;
- movement;
- styling intention;
- customer preference.
A shopper who prefers relaxed jeans may reject exactly the fit another customer considers ideal. Similarly, a stretch-knit garment can accommodate body variation differently from rigid woven trousers. Body measurements should therefore be treated as one side of the fit equation.
For a detailed explanation of how the data is physically captured, see 3D body scanning for apparel fit and sizing.
The operational constraints around accuracy, consumer adoption, privacy, scanning conditions, cost, and production integration are separate questions and are covered more appropriately in the practical limits of 3D scanning in fashion retail and production.
Common Mistakes When Brands Interpret Body Scan Data
Designing for the Average Customer
The average can summarize a dataset, but it may describe relatively few individuals well. Sizing decisions require distributions, measurement combinations, and coverage analysis—not just mean values.
Assuming the Dataset Represents the Brand's Customers
A national anthropometric survey, third-party dataset, or convenient sample may differ materially from the people buying the product. Before using external data, brands should understand sample demographics, geography, age range, measurement protocol, collection period, and intended population.
Treating Every Measured Difference as a New Fit Category
Human bodies vary continuously. Creating a new size or shape for every statistical cluster would quickly make ready-to-wear commercially unmanageable. Segmentation should solve identifiable fit and business problems.
Looking at Dimensions Independently
A waist measurement without its relationship to hip, stature, torso length, or other relevant dimensions may give an incomplete picture. Apparel fit frequently depends on combinations.
Assuming Size-Chart Coverage Equals Garment Fit
Coverage indicates whether body dimensions fall within defined measurement ranges. It does not prove that a specific garment pattern will fit comfortably or aesthetically. Physical or appropriately validated digital fit testing is still necessary.
Changing Grade Rules Before Checking the Base Pattern
If the original block poorly represents the target customer shape, sophisticated grading may simply reproduce the same fit problem across a wider range. The technical team should distinguish base-pattern problems from grading problems.
What Brands Should Verify Before Acting on Scan Data
Before restructuring a size system, apparel teams should verify several fundamentals.
First, confirm that measurement definitions are compatible. A scanner's “waist circumference” should not be assumed to match the waist position in a legacy size chart or pattern specification without checking the anatomical definition.
Second, inspect the sample. Ask who was scanned, how participants were recruited, when the data was collected, and whether the dataset represents the intended product market.
Third, determine whether the important insight is about size, proportion, or shape. These lead to different technical responses.
Fourth, analyze the commercial consequences. A sizing solution that theoretically improves population coverage can still be impractical if it multiplies SKUs beyond what the business can reliably stock.
Finally, validate any proposed changes with garments. Anthropometric data can tell a technical team what bodies look like. Product development must determine how clothing should interact with them.
FAQ: Using Body Scan Data for Apparel Sizing
How much body scan data does a fashion brand need?
There is no universally correct number of scans. The required sample depends on the population being studied, the diversity within that population, the measurements being analyzed, the statistical method, and the business decision involved.
A small sample can be useful for exploratory fit work but should not be presented as representative of a broad population without evidence. Large surveys can provide stronger population insight when sampling is designed appropriately.
For a brand, relevance is just as important as scale. Thousands of scans from the wrong population may be less useful than a well-designed dataset closely aligned with the intended customer segment.
Can body scan data tell a brand what its size chart should be?
It can provide the anthropometric evidence needed to design or evaluate a size chart, but it does not dictate one unique solution. Brands must still choose primary dimensions, measurement intervals, number of sizes, target coverage, garment categories, fit philosophy, and commercial complexity.
ISO 8559-3 provides a methodology for using body-dimension data to establish measurement tables and intervals, illustrating why size-system development involves statistical interpretation rather than simply copying raw measurements. Two brands analyzing the same population could therefore develop different legitimate sizing systems because they serve different products and positioning.
Why can two people with the same measurements need different garment fits?
Because a small set of circumference measurements does not describe the entire three-dimensional body. Two people with similar waist and hip girths can distribute that volume differently across width, depth, abdomen, buttocks, or posture. Torso and leg proportions can also differ.
Garment construction matters as well. A highly fitted woven trouser responds more sensitively to certain shape differences than an elastic-waist relaxed trouser. This is one reason 3D body data can add value: it allows researchers and apparel teams to analyze geometry and proportions that may remain hidden when only a few tape measurements are available.
Can scan data show why customers are between sizes?
It can help identify the anthropometric component of the problem. For example, customers may consistently match one size at the bust but another at the waist or hip. Mapping these combinations across a dataset can reveal whether the pattern is common or isolated.
However, scan data alone cannot establish that body proportions are the sole reason customers struggle with sizing. Product dimensions, fabric, grading, labeling, fit preference, and manufacturing variation should also be investigated. The strongest analysis combines body data with product-level fit evidence rather than treating customer measurements as the only variable.
Should brands create different fits for different body shapes?
Sometimes, but only when the evidence and business model support it. A recurring body-shape group may justify a separate fit block if the existing pattern systematically under-serves that group and the segment is commercially meaningful. Examples might include curvy trouser fits, petite or tall proportions, or specialized athletic builds.
The trade-off is operational complexity. Additional fits create more patterns, samples, SKUs, inventory decisions, and customer choices. Body-shape segmentation is most useful when it solves a clear, repeatable fit problem rather than merely demonstrating that customers are anatomically different.
How often should apparel brands update anthropometric assumptions?
There is no universal refresh interval. The need depends on how quickly the target market changes, how old the underlying data is, whether the brand expands geographically or demographically, and whether fit performance suggests that existing assumptions remain appropriate.
ISO 8559-3 explicitly recognizes that body-dimension distributions can change over time while also noting that a size table does not necessarily need revision if products continue to accommodate the target population. Brands should therefore monitor fit performance and customer composition rather than changing their size charts simply because a newer dataset becomes available.
Is more detailed body data always better for apparel sizing?
No. Additional variables are useful only when they improve understanding or decision-making.
A recent clothing-size prediction study using scan-derived anthropometric measurements found that a model using selected key dimensions outperformed a more complex approach incorporating a broader variable set in that particular dataset. This should not be interpreted as proof that fewer measurements are universally superior; rather, it illustrates that adding variables does not automatically improve a sizing model. For apparel businesses, the priority should be selecting measurements that have clear technical relevance to the garment being developed.
Conclusion
The most important contribution of 3D body scanning to apparel sizing is not the ability to produce a digital replica of one customer. It is the ability to examine many bodies systematically. When scan data is analyzed at population level, brands can see distributions rather than averages, relationships rather than isolated measurements, and recurring body shapes rather than relying on a single idealized fit model. They can test whether an existing size chart genuinely represents the people it is supposed to serve and identify where customers repeatedly fall outside its assumptions.
That evidence does not remove the compromises inherent in ready-to-wear clothing. A mass-produced size system must still reduce enormous human variation into a manageable set of patterns and SKUs. Adding every possible measurement or body shape would defeat the operational logic of ready-to-wear.
The strategic opportunity is therefore more disciplined: use body data to decide which differences matter enough to design around. For apparel businesses, that can turn sizing from a largely inherited convention into a system that can be measured, questioned, tested, and refined against real customers.





Comments 0
Leave a CommentSend Comment
Anda harus Login terlebih dahulu untuk dapat memberikan komentar.