

Inventory Turnover Strategies Every Fashion Business Should Know
Quick Answer
Fashion inventory turnover strategies are the planning and operational methods used to sell and replace stock at a commercially healthy pace without creating excessive markdowns, chronic stockouts, or unnecessary working-capital pressure.
The most effective strategy is not simply to minimise inventory. Fashion businesses need to differentiate between replenishable basics, seasonal products, trend-led items, limited editions, and long-lifecycle merchandise. Each group requires a different approach to initial buying, safety stock, replenishment, allocation, transfer, pricing, and end-of-season action.
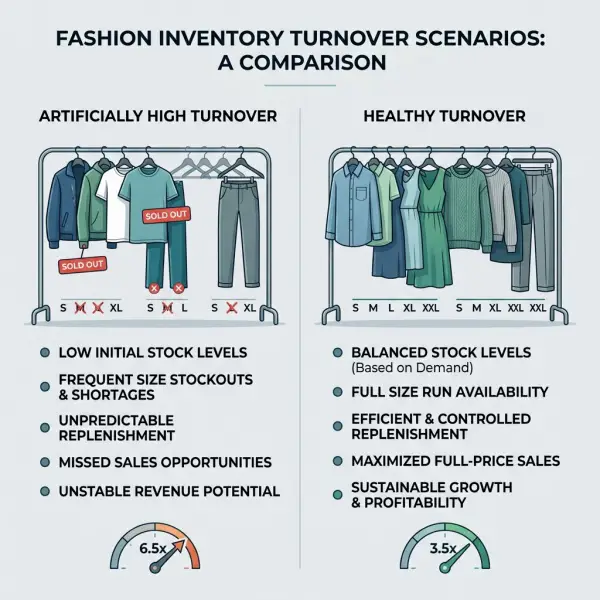
Inventory turnover is commonly calculated by dividing cost of goods sold by average inventory at cost. A higher ratio generally indicates that inventory moves through the business more frequently, but it is not automatically better. Turnover can also rise because a retailer holds too little stock, repeatedly sells out, or discounts products aggressively.
Fashion businesses should therefore evaluate turnover alongside gross margin, full-price sell-through, SKU availability, stock cover, inventory aging, and customer demand. The objective is productive inventory: enough stock to capture profitable demand, but not so much that cash and margin become trapped in products with weakening commercial relevance.

What Is Inventory Turnover in a Fashion Business?
Inventory turnover is a financial efficiency ratio that measures how frequently a business converts its average inventory investment into cost of goods sold during a defined period.
The standard financial formula is:
Inventory Turnover = Cost of Goods Sold ÷ Average Inventory at Cost
Average inventory is often calculated as:
Average Inventory = (Beginning Inventory + Ending Inventory) ÷ 2
When annual figures are used, approximate days in inventory can also be calculated as:
Days in Inventory = 365 ÷ Inventory Turnover
OpenStax describes inventory turnover as cost of goods sold divided by average inventory and explains that the related days-in-inventory ratio estimates how long inventory would remain at the measured sales rate. OpenStax explanation of inventory turnover
Suppose a fashion retailer records annual cost of goods sold of $1.2 million and average inventory at cost of $300,000:
Inventory Turnover = $1,200,000 ÷ $300,000 = 4 turns
That equates to approximately:
365 ÷ 4 = 91 days in inventory
This does not mean that every garment remains in stock for exactly 91 days. It is an aggregate financial indicator. Some products may sell in two weeks, while others remain for most of the year.
Why average inventory requires care in seasonal fashion
Using only beginning and ending inventory can produce a misleading result when stock levels change sharply during the year.
A resortwear retailer may build inventory before the holiday season and hold much less stock after it ends. If both the beginning and ending balances fall outside the peak buying period, the simple average may understate the capital actually committed during the year.
Fashion businesses with strong seasonality should consider using monthly, weekly, or period-weighted average inventory when reliable data are available. Whatever approach is selected should be applied consistently when comparing periods, categories, or business units.
Financial turnover is different from SKU-level movement
The accounting ratio normally uses cost values. Operational teams may also monitor unit movement, sell-through, stock cover, and sales velocity.
These measures answer related but different questions:
|
Metric |
Main question answered |
|
Financial inventory turnover |
How frequently was the average inventory investment converted into cost of goods sold? |
|
Unit sales velocity |
How many units does a SKU sell per day, week, or month? |
|
Sell-through rate |
What proportion of available or received units sold during a defined period? |
|
Stock cover |
How long might current inventory last at the expected sales rate? |
|
Inventory aging |
How long has current stock remained unsold or inactive? |
|
Full-price sell-through |
How much inventory sold before markdown intervention? |
A product can move quickly in units while generating weak margin. Another may move slowly but remain commercially attractive because it has high margin, limited obsolescence risk, and a long selling lifecycle.
This is why turnover should guide decisions rather than dictate them.
Is a Higher Inventory Turnover Always Better?
No. Higher inventory turnover is useful only when it reflects strong, profitable sales supported by acceptable product availability and operating cost.
Turnover can increase for healthy reasons:
- Demand becomes stronger.
- Initial buys become more accurate.
- Replenishment becomes faster.
- Slow inventory is reduced.
- Allocation improves.
- Returns re-enter sellable stock more quickly.
- The business operates with less unnecessary safety stock.
It can also increase for unhealthy reasons:
- The retailer buys too little.
- Important sizes repeatedly sell out.
- Products are cleared through deep discounts.
- Supplier orders become smaller but more expensive.
- Emergency freight is used frequently.
- Inventory records omit stock that physically exists.
- Revenue declines faster than inventory is being replenished.
Research examining 311 publicly listed retailers found that inventory turnover varied substantially across retailers and periods and was associated with factors such as gross margin, capital intensity, and unexpected sales. The study cautions against treating turnover as a simple standalone benchmark. Research on retail inventory turnover performance
A jewellery retailer, premium leather-goods business, fast-fashion chain, and basic underwear brand should not be expected to achieve the same inventory turnover. Their margins, replenishment options, product lifecycles, customer expectations, and risks of obsolescence differ.
The better question is not, “How high can turnover become?”
It is, “Does the current inventory investment generate sufficient margin while maintaining the availability promised to customers?”

Strategy 1: Segment Inventory by Product Role and Lifecycle
The first turnover strategy is to stop managing every fashion product under the same inventory policy.
A permanent white T-shirt, a winter coat, a runway-inspired dress, and a limited collaboration may all belong to the same retailer, but their inventory economics are very different.
A useful merchandise segmentation might include:
|
Product role |
Typical inventory approach |
|
Core or continuity product |
Maintain planned availability and replenish repeatedly |
|
Seasonal continuity product |
Replenish only within a defined seasonal window |
|
Fashion product |
Use a controlled initial buy and limited reorder opportunity |
|
Trend-led product |
Keep initial exposure relatively cautious unless demand evidence is strong |
|
Limited edition |
Set a fixed quantity aligned with scarcity and brand positioning |
|
Test product |
Use a small quantity to collect demand, fit, and price information |
|
Long-lifecycle premium item |
Accept slower movement when margin and relevance justify the investment |
|
Clearance or exit product |
Stop replenishment and focus on recovering value within a deadline |
Lifecycle rules should determine when replenishment starts, when it stops, and what happens as a product moves from launch to maturity and exit. Oracle’s current retail inventory documentation uses lifecycle strategies to create time-phased allocation and replenishment plans, including activate and deactivate dates for short-lifecycle or seasonal items. Oracle Retail lifecycle allocation and replenishment documentation
Without product segmentation, retailers tend to make one of two mistakes. They reorder short-lived fashion products as though demand will continue indefinitely, or they manage essential basics so cautiously that customers repeatedly encounter stockouts.
The product role should be assigned before launch and reviewed when actual demand becomes visible.
Strategy 2: Improve the Initial Buy Before Trying to Accelerate Sales
Inventory turnover is partly determined before the product reaches a store.
An excessive initial order creates a large denominator in the turnover calculation and increases the quantity that must be sold before inventory can reach a healthy position. Marketing and markdowns may later accelerate movement, but they cannot fully repair a purchase commitment that was far larger than realistic demand.
An effective initial buy should consider:
- Demand for comparable styles
- Product novelty
- Selling price
- Size and color mix
- Planned store and channel coverage
- Supplier lead time
- Minimum order quantities
- Replenishment flexibility
- Remaining seasonal window
- Gross margin
- Planned promotional activity
- Consequence of a stockout
- Consequence of unsold units
The objective is not to eliminate risk. New fashion products always involve uncertainty. The objective is to control the amount of capital exposed before the business has meaningful sales evidence.
Buy shallow where uncertainty is high
A shallow initial buy means purchasing fewer units of an uncertain product while preserving the possibility of reordering if demand proves strong.
This strategy can improve turnover because weak products create less leftover inventory. It works best when the supply chain can respond within the selling window.
A shallow buy is less useful when:
- Supplier lead times are longer than the product lifecycle.
- Minimum order quantities make reorders uneconomic.
- Materials cannot be reserved.
- Factory capacity is unlikely to remain available.
- Customers expect immediate broad availability.
- Replenishment would arrive after the campaign or season.
A smaller initial order is therefore not automatically safer. It can simply shift risk from excess inventory to lost sales.
Use test orders for genuinely new propositions
A test order is useful when a product differs materially from historical references in silhouette, fabric, function, customer segment, price, or channel.
The test should be large enough to produce useful information but small enough to limit the cost of a weak response. Results should be interpreted alongside availability, marketing exposure, customer feedback, returns, and fit data.
A product that sells only 20 units may have failed. It may also have been available in one store, received little promotion, or sold out immediately in its most important size.
Testing is valuable only when the business records the conditions under which the test occurred.
Strategy 3: Build Better Size and Color Curves
Improving total inventory turnover requires attention to the composition of stock, not only the total quantity.
A style with a healthy overall sales rate can still leave substantial residual inventory when the size or color curve is wrong. Core sizes disappear, customer demand becomes constrained, and the remaining fringe variants require discounts.
The size curve should reflect:
- Product category
- Garment fit and pattern ease
- Target customer profile
- Stretch and fabric behaviour
- Channel
- Region or store cluster
- Historical availability
- Return reasons
- Comparable product demand
- Any intentional inclusivity or range commitment
Historical sales must be adjusted for stockouts. If size large was unavailable for half the season, its recorded sales do not represent unconstrained demand.
Color planning requires similar discipline. Offering additional colors can increase customer choice, but each color may introduce production minimums, separate SKU management, photography, allocation, and residual-stock risk.
For many small brands, fewer colors with stronger size availability may produce healthier turnover than a broad color assortment with inadequate depth. That is a commercial judgement, not a universal rule. Color variety may remain central to brands whose customer proposition depends on choice.

Strategy 4: Replenish According to Product Demand and Remaining Selling Time
Replenishment increases inventory after sales begin. It can improve turnover by keeping proven products available without requiring a large initial commitment.
The strongest replenishment decisions combine:
- Current sellable stock
- Sales velocity
- Forecast demand
- Stock already on order
- In-transit stock
- Supplier lead time
- Review frequency
- Safety-stock policy
- Minimum order quantity
- Remaining selling time
- Expected margin
- Return behaviour
- Product lifecycle status
Oracle describes retail replenishment as the process of monitoring inventory conditions and creating orders or transfers while considering demand and operating constraints. Current Oracle inventory-optimisation documentation also supports item-location replenishment policies and time-phased plans across supply-chain locations. Oracle Retail Inventory Planning Optimization
Set a final reorder date
Every seasonal or short-lifecycle product should have a final practical reorder date.
After this date, additional stock is unlikely to arrive with enough time to sell at an acceptable price. The date should consider production, quality control, transportation, receiving, allocation, and the actual end of customer demand—not merely the official end of the season.
A product may continue selling after the reorder deadline. That does not mean a late reorder is justified.
The relevant question is whether new units can arrive and sell before demand and margin weaken.
Separate continuity replenishment from fashion replenishment
Continuity products can often use repeatable reorder points, target stock, or forecast-based replenishment.
Fashion products need more judgement. A rapid launch can be followed by an equally rapid decline, particularly when sales were driven by a campaign, celebrity exposure, specific event, or short trend cycle.
A fashion reorder should therefore consider whether recent sales represent persistent demand or temporary attention.
Review returns before reordering
Gross sales can overstate product demand when returns are high.
A style that sells 500 units and receives 150 returns does not present the same replenishment signal as a style with 500 sales and 20 returns. Return timing may delay complete analysis, but known fit, quality, description, or expectation problems should be reviewed before placing additional orders.
Strategy 5: Shorten Lead Times Without Ignoring Cost and Quality
Shorter lead times can improve inventory turnover because the business can commit later, respond to actual demand, and carry less speculative stock.
Reducing lead time may involve:
- Reserving greige fabric or common materials
- Standardising selected trims
- Using repeatable garment blocks
- Pre-approving packaging
- Locating part of production closer to the target market
- Improving supplier communication
- Reducing sample and approval delays
- Booking production capacity in advance
- Splitting orders into planned delivery phases
- Improving transport and customs preparation
The commercially useful measure is not factory sewing time alone. Fashion businesses should track the full lead time from decision to sellable availability.
A supplier may produce a garment in ten days, but the effective replenishment lead time could still be six weeks after material purchasing, approval, quality control, freight, customs, warehouse receiving, and store allocation are included.
Faster supply is not automatically cheaper
Local or responsive production may reduce inventory exposure but increase unit manufacturing cost. Offshore volume production may lower unit cost while requiring larger orders and earlier commitments.
The correct choice depends on total economics:
- Unit cost
- Minimum order quantity
- Freight and duty
- Lead-time variability
- Quality risk
- Markdown exposure
- Lost-sales risk
- Financing period
- Management complexity
- Product margin
- Remaining product lifecycle
The lowest factory price is not necessarily the lowest commercial cost.
Use a hybrid sourcing model where appropriate
Some brands divide supply between predictable volume and responsive capacity.
A baseline quantity may be produced through a cost-efficient supplier, while a second source or reserved production window supports faster replenishment. This model can reduce exposure, but maintaining two capable supply routes adds complexity and may reduce purchasing leverage.
Hybrid sourcing works only when specifications, materials, fit, quality standards, and product data remain consistent across suppliers.
Strategy 6: Allocate Inventory to Demand, Not Equally to Every Store
Equal allocation is administratively simple. It is rarely the most productive method when locations differ in customer profile, climate, traffic, size demand, selling space, and historical performance.
A healthier allocation process places inventory where each SKU has the strongest realistic selling opportunity.
Initial allocation may consider:
- Comparable-product sales by location
- Store cluster
- Local customer profile
- Climate and season timing
- Store capacity
- Size demand
- Channel strategy
- Launch priority
- Minimum display quantities
- Ability to replenish quickly
Once sales begin, allocation should become more dynamic. Stronger locations may receive additional stock, while weak locations retain only enough units to maintain a coherent presentation.
Research into dynamic allocation for seasonal merchandise has examined how limited stock can be distributed from a central facility to multiple retail locations during the selling season to improve revenue outcomes. The effectiveness depends on demand information, network design, and implementation conditions. Research on dynamic inventory allocation for seasonal merchandise
Preserve part of uncertain inventory centrally
Allocating every unit to stores before demand becomes clear can make later rebalancing expensive.
A central reserve allows the retailer to respond to early sales signals. The appropriate reserve depends on launch strategy, warehouse capacity, store presentation requirements, shipping speed, and demand uncertainty.
Holding too much centrally can also reduce store availability. The reserve should support flexibility, not become an excuse for indecision.
Strategy 7: Transfer Inventory Before Discounting It
A product that sells slowly in one location may remain commercially healthy elsewhere.
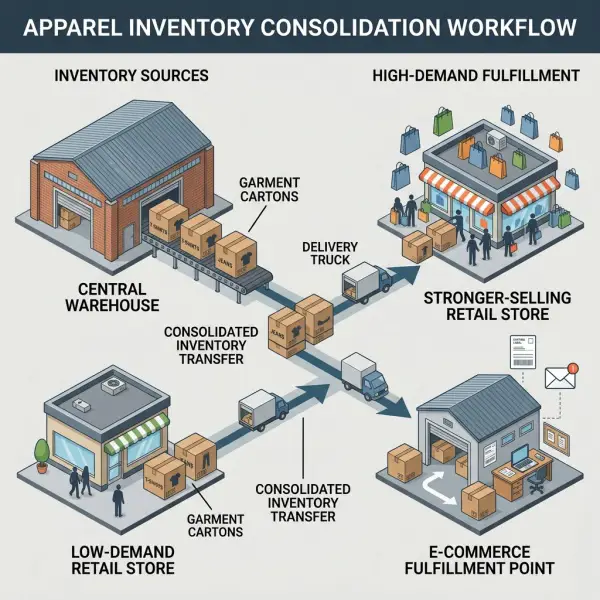
Inventory transfers can improve turnover by moving stock from weak-demand locations to stronger ones. Oracle’s retail inventory-optimisation documentation includes rebalancing recommendations between locations to support sell-through and reduce avoidable markdown exposure. Oracle inventory rebalancing documentation
A transfer decision should consider:
- Demand at the receiving location
- Remaining selling time
- Number and value of units
- Size-range completeness
- Packing and transport cost
- Store labor
- Risk of damage
- Environmental impact of additional movement
- Likelihood that the units will sell at a better margin
Moving one low-value garment across a large network may cost more than the expected margin recovery. Transferring a coordinated size assortment of high-value outerwear could be commercially worthwhile.
Use thresholds rather than ad hoc transfers
A repeatable transfer rule may require:
- Excess stock above a defined cover level at the source
- Forecast shortage at the destination
- Minimum transfer quantity or value
- Sufficient remaining lifecycle
- Expected margin recovery above transfer cost
These rules prevent teams from moving stock merely to make one store’s report look cleaner.
Strategy 8: Act on Aging Stock Before the Final Clearance Period
Aging stock rarely becomes easier to sell merely because the business waits.
Early intervention gives the retailer more options and usually requires less aggressive action than a final clearance conducted after customer interest and size availability have weakened.
The first response should not always be a markdown. Weak movement may result from:
- Poor product-page photography
- Incomplete descriptions
- Incorrect categorisation
- Limited store visibility
- Weak styling communication
- A price-positioning mismatch
- Stock located in the wrong channel
- Important sizes being unavailable
- A delayed launch
- Fit or quality concerns
Once these issues are reviewed, the brand can choose an appropriate intervention.
Use an aging action ladder
A staged framework can protect margin while keeping decisions timely:
|
Inventory condition |
Possible action |
|
Early underperformance, full size range |
Improve presentation, content, placement, or campaign targeting |
|
Uneven location performance |
Transfer or expose inventory to broader channels |
|
Strong product interest but weak conversion |
Review price, fit information, imagery, reviews, or delivery promise |
|
Moderate aging with remaining relevance |
Use targeted promotion, styling bundle, or selected customer offer |
|
Broken size or color range |
Apply variant-level intervention where systems allow |
|
Late lifecycle with significant stock |
Use planned markdowns with clear exit dates |
|
Commercially obsolete or damaged stock |
Assess repair, outlet, liquidation, donation, recycling, or write-off |
Markdown optimisation research treats the timing and depth of price reductions as linked to remaining inventory, demand, and the deadline for clearing products. A deployed Walmart system, for example, balanced clearance deadlines against the discounts and relabelling work required, although its results are specific to that retailer and implementation. Research on retail clearance markdown optimisation
Prefer targeted action over blanket discounts
A style may be overstocked only in one color, size group, location, or channel.
Discounting every variant sacrifices margin where demand may still support the regular price. Variant-level markdowns, targeted customer offers, or location-specific action can be more precise, although they require suitable systems and clear customer communication.
Strategy 9: Improve Inventory Accuracy and Return-to-Stock Speed
Turnover calculations are only as reliable as the inventory data used to produce them.
Phantom stock can make turnover appear slower or faster depending on where the error occurs. Unrecorded stock may trigger unnecessary purchasing. System stock that does not physically exist may suppress replenishment and produce customer cancellations.
Core controls include:
- Barcode or radio-frequency identification scanning
- Receiving confirmation
- Recorded transfers
- Cycle counting
- Reason-coded adjustments
- Return-status management
- Damaged-stock controls
- Reservation and cancellation reconciliation
- Integration between stores, warehouse, e-commerce, and marketplaces
For many small businesses, the operational priority is not more advanced forecasting. It is ensuring that sales, receipts, returns, transfers, damages, and cancellations update one trusted inventory record.
Returns should not remain in operational limbo
A returned garment may be physically present but excluded from sellable inventory while it waits for inspection.
The business should classify it quickly as:
- Sellable at full price
- Sellable after repackaging or pressing
- Repairable
- Suitable only for a reduced-price channel
- Subject to supplier claim
- Unsellable
Slow return processing reduces the remaining time available to resell seasonal products. Improving return-to-stock speed can increase productive availability without purchasing additional inventory.

Strategy 10: Use Open-to-Buy Discipline to Preserve Flexibility
Open-to-buy, or OTB, is a merchandise budgeting method that estimates how much purchasing capacity remains after planned sales, stock targets, existing inventory, and outstanding orders are considered.
The purpose is not merely to limit spending. OTB helps prevent the business from committing all available cash before demand becomes visible.
Fashion retailers can preserve part of the buying budget for:
- Replenishing proven products
- Responding to stronger categories
- Testing emerging demand
- Replacing supplier cancellations
- Supporting events or weather changes
- Correcting an initial assortment imbalance
OTB reports need current data. A plan that omits purchase orders, cancellations, markdowns, returns, or delayed receipts can overstate the amount genuinely available to spend.
The financial consequences of buying too much too early are examined in how poor stock planning reduces fashion brand profitability.
Strategy 11: Combine Turnover With Margin and Availability
Inventory turnover measures speed. It does not measure the quality of that speed.
A retailer should combine turnover with measures that show whether inventory is producing margin and supporting demand.
Gross margin return on inventory investment
Gross margin return on inventory investment, commonly abbreviated as GMROI or GMROII, compares gross margin generated during a period with the average inventory investment at cost.
A simplified formula is:
GMROI = Gross Margin Dollars ÷ Average Inventory at Cost
Suppose two fashion categories each hold average inventory of $100,000:
|
Category |
Inventory turnover |
Gross margin generated |
GMROI |
|
Category A |
5 turns |
$80,000 |
0.80 |
|
Category B |
3 turns |
$130,000 |
1.30 |
Category A moves stock faster, but Category B generates more gross margin for each dollar of average inventory.
ASCM also documents a related Turn-Earn Index that combines inventory turnover and gross-margin percentage. Its underlying logic is that lower-margin products generally need stronger turnover, while higher-margin products may support a lower turnover rate. ASCM inventory and supply optimisation metrics
The formula definition should remain consistent within the company. Different systems may label and calculate retail productivity measures differently.
Full-price sell-through
Turnover created by deep discounting is different from turnover created by healthy full-price demand.
Full-price sell-through identifies how much merchandise moved before markdown intervention. It helps buyers distinguish between strong product acceptance and units cleared primarily through price reductions.
Availability and stockout indicators
A category can report impressive turnover because the business did not hold enough inventory.
Track whether core sizes remained available and whether customers encountered stockouts during the main selling period. Restock requests, unavailable product-page visits, unfulfilled store inquiries, and canceled orders can provide evidence of constrained demand.
Inventory aging
Turnover at category level can hide individual products that have stopped moving.
Aging reports should identify stock by product, SKU, location, collection, and last-sale date. Strong bestsellers should not be allowed to conceal weak inventory elsewhere in the category.
A Balanced Inventory Turnover Scorecard
A practical fashion inventory scorecard can include:
|
Metric |
What it reveals |
Risk if viewed alone |
|
Inventory turnover |
Speed of inventory conversion |
May reward understocking or discounting |
|
Days in inventory |
Approximate holding duration |
Aggregate figures hide individual aging SKUs |
|
Full-price sell-through |
Strength of regular-price demand |
Does not show absolute margin or availability |
|
Realised gross margin |
Profit retained after markdowns |
May ignore the amount of inventory invested |
|
GMROI |
Gross margin relative to stock investment |
Can vary with accounting and period definitions |
|
Stock cover |
Forward-looking inventory sufficiency |
Sensitive to forecast assumptions |
|
Core-size availability |
Ability to serve relevant demand |
Requires category-specific size priorities |
|
Stockout rate |
Frequency of unavailable demand |
Lost demand may be difficult to quantify |
|
Aging inventory value |
Capital exposed to weakening products |
Different product lifecycles require different thresholds |
|
Return-to-stock time |
Speed of recovering returned units |
Does not explain why customers returned products |
|
Inventory accuracy |
Reliability of stock data |
High accuracy does not guarantee a healthy assortment |
|
Markdown dependency |
Reliance on reduced prices |
Some markdowns may be planned and commercially valid |
The scorecard should be reviewed at several levels:
- Company
- Category
- Collection or season
- Product style
- Color
- Size
- Store or region
- Sales channel
- Supplier
A company-level turnover figure is useful for financial oversight. It is too broad for deciding whether a specific green blouse in size medium should be reordered, transferred, or marked down.





Comments 0
Leave a CommentSend Comment
Anda harus Login terlebih dahulu untuk dapat memberikan komentar.