

How Poor Stock Planning Reduces Fashion Brand Profitability
Quick Answer
Poor stock planning reduces fashion brand profitability by creating an expensive mismatch between customer demand and the products, sizes, colors, quantities, locations, and selling periods available to meet it.
When a brand buys too much, it may need deeper markdowns, additional storage, repeated handling, outlet distribution, liquidation, or inventory write-downs. When it buys too little, it can lose full-price sales, waste marketing expenditure, disappoint customers, and miss the opportunity to reorder while demand remains active.
The problem is not limited to total unit quantity. A brand may own enough inventory overall while still being understocked in popular sizes, overstocked in weak colors, or holding merchandise in locations where demand is limited.
Profitability therefore depends on the quality of the inventory mix, not simply the amount of stock. Strong planning aligns product assortment, SKU-level demand, supplier lead time, purchasing budget, channel allocation, pricing strategy, and the remaining selling window.
Poor stock planning can damage gross margin, working capital, cash flow, operational efficiency, and future buying flexibility at the same time. These effects may remain hidden when management looks only at sales revenue or total units sold.

What Is Poor Stock Planning in Fashion Retail?
Poor stock planning is the failure to align inventory purchases and availability with realistic demand by product, size, color, location, channel, price point, and selling period.
It can occur before a purchase order is issued, when a team chooses an inappropriate quantity or size curve. It can also develop later through weak allocation, delayed replenishment, inaccurate inventory records, slow transfers, or late markdown decisions.
Stock planning is therefore broader than deciding how many garments to order. It determines:
- Which products enter the assortment
- How many units are purchased or produced
- How units are divided by size and color
- When products are expected to arrive
- Which stores or channels receive them
- Whether products can be replenished
- How much inventory remains available for future demand
- When commercial intervention becomes necessary
The operational foundation of this process is explained in fashion inventory management for retail businesses. The profitability issue begins when those inventory decisions no longer reflect the product’s actual commercial opportunity.
Overstock and understock can exist simultaneously
A fashion business can be overstocked and understocked at the same time.
Imagine a retailer holding 2,000 units of trousers. At style level, the quantity may appear sufficient. At SKU level, however, the business may have already sold out of medium and large sizes while holding excessive quantities of extra-small and an unpopular color.
The retailer has too much inventory in financial terms but too little inventory from the customer’s perspective.
This distinction matters because total stock value cannot explain whether the inventory is commercially useful. A more accurate assessment considers whether the available stock matches the variants customers are still willing to buy.
Why Is the Profit Damage Often Difficult to See?
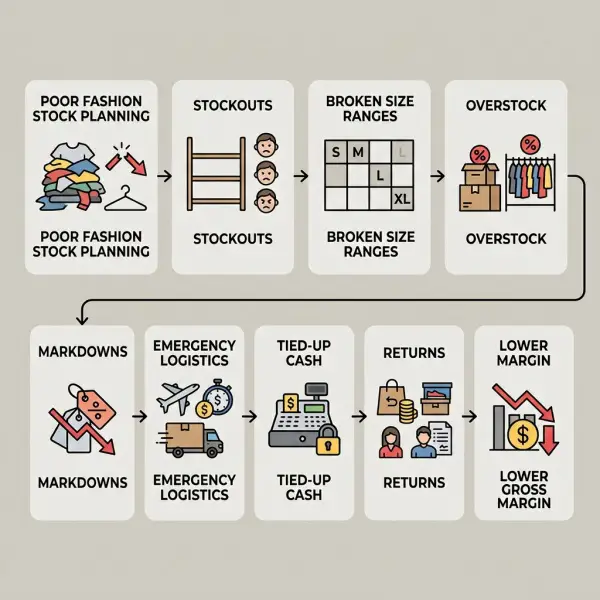
Stock planning errors rarely appear as one clearly labelled expense. Their effects are distributed across sales, gross margin, logistics, storage, marketing, customer service, returns, and working capital.
A management team may initially see strong revenue because the brand purchased and sold a large quantity of products. The apparent success can conceal several weaknesses:
- A high share of units was sold only after discounting.
- Bestselling sizes were unavailable during peak demand.
- Marketing continued after commercially important SKUs sold out.
- New collections were delayed because cash remained tied up in older inventory.
- Employees spent time moving, counting, repacking, and reconciling weak stock.
- Inventory losses were recognised only at the end of the season.
Revenue alone does not reveal these effects. A brand can increase revenue while generating less gross profit if it purchases significantly more inventory and relies on discounting to sell it.
Profitability analysis must therefore connect sales with initial margin, markdowns, inventory cost, returns, fulfillment expenses, remaining inventory value, and the time required to recover the original cash investment.
How Does Excess Inventory Reduce Fashion Profitability?
Excess inventory reduces profitability when the eventual economic value of the stock falls below the assumptions used when it was purchased.
The merchandise may still be physically usable, but its commercial value can decline as the season progresses, competing products arrive, customer attention changes, or important sizes become unavailable.
Markdown pressure reduces the realised selling price
The initial retail price is not the price that ultimately determines profitability. The relevant figure is the average realised selling price after promotions, markdowns, returns, and other reductions.
Suppose a jacket is designed to sell for $100 and costs the retailer $40 before broader operating expenses. At full price, it creates $60 of initial gross margin. If the jacket is sold at a 30% discount, revenue falls to $70 and gross margin falls to $30.
The selling price decreased by 30%, but gross margin decreased by 50%.
This is why markdown depth should be evaluated against unit cost and margin, not only against the original retail price. A seemingly moderate discount can remove a much larger proportion of profit.
Markdowns are a legitimate retail tool. They can help clear seasonal products, stimulate demand, and release inventory capacity. The problem is not the existence of markdowns, but dependence on unplanned, late, or unnecessarily deep discounting caused by incorrect stock commitments.
Research into retail clearance optimisation treats markdown decisions as a balance between clearing inventory by a required date and limiting the revenue sacrificed through discounts. A large-scale Walmart implementation, for example, was designed to reduce excess stock while minimising the discount needed to clear it. Its results should be understood as one retailer-specific application rather than a universal benchmark. Walmart clearance markdown optimisation research
Late markdowns may require deeper intervention
A retailer that identifies weak demand early has several options. It can improve product presentation, adjust advertising, transfer stock, target a more appropriate customer group, bundle the item, or introduce a controlled price reduction.
When action is delayed until the end of the selling period, fewer options remain. The brand may need a deeper discount because:
- Customer attention has shifted to newer collections.
- Competitors are already clearing similar products.
- The remaining size assortment is incomplete.
- The product has limited relevance in the next season.
- Warehouse or store space is needed for incoming inventory.
- Cash must be recovered for new purchasing commitments.
Early intervention does not guarantee full-price sell-through, but it gives the business more room to protect value.

Unsold inventory may require a financial write-down
Under International Financial Reporting Standards, IAS 2 generally requires inventory to be measured at the lower of cost and net realisable value. Net realisable value is the estimated ordinary selling price less expected completion and selling costs. If the expected recoverable amount declines below cost, a write-down may be necessary. Local accounting standards and tax treatment can differ. IAS 2 Inventories
A write-down does not create the underlying commercial problem. It recognises that part of the inventory’s expected value has already been lost.
This can happen when merchandise becomes damaged, obsolete, incomplete, heavily discounted, or unlikely to sell at a price sufficient to recover its recorded cost and necessary selling expenses.
Old inventory absorbs space and attention
Excess stock creates operational costs even before it is marked down.
It occupies warehouse racks, stockroom capacity, store fixtures, and management attention. It must be counted, insured, protected, moved, reported, and reconciled. It can also complicate picking, increase handling, and make newer inventory harder to locate.
Not every one of these costs is visible at SKU level. Many appear in shared warehouse, labor, or occupancy expenses. This makes slow inventory look less expensive than it actually is.
How Do Stockouts Reduce Profitability?
A stockout occurs when a customer wants to purchase a product or SKU but the business cannot supply it at the required time or location.
The immediate loss is the gross margin that could have been earned from the unavailable item. The broader impact depends on what the customer does next.
Retail research has identified several possible responses to product unavailability. Customers may switch to another item, shop at a competing retailer, delay the purchase, or abandon it entirely. The response varies according to the product, consumer, urgency, available alternatives, and retail situation. Research on consumer responses to stockouts
Lost sales are not always visible in sales reports
Sales data record completed transactions. They do not automatically record customers who could not find their size, abandoned an online cart after seeing an out-of-stock notice, or purchased from a competitor.
This creates a forecasting problem. If the brand uses recorded sales as a direct representation of demand, it may conclude that an unavailable SKU had weak demand.
In reality, sales were limited by inventory.
Research on demand estimation has shown that inaccurate inventory information and censored sales observations can create downward bias in estimated demand under certain modelling assumptions. Research on demand estimation under inventory uncertainty
For fashion retailers, the distortion can be particularly serious at size level. A popular size that sells out early may produce fewer recorded unit sales than a less popular size that remains available throughout the entire season.

Marketing expenditure becomes less productive
Advertising a product that cannot be purchased in commercially important variants wastes part of the marketing investment.
A campaign may still produce brand awareness, but its immediate conversion value falls when customers reach a product page or store and cannot find the required size, color, or delivery option.
Brands can also create a video to showcase new collections, product features, or styling ideas, helping customers better understand products while supporting more effective marketing campaigns.
The problem becomes more expensive when the brand continues paid advertising because inventory is inaccurate. A system may show units as available even though they are missing, damaged, reserved, or located somewhere that cannot fulfill the order.
Stockouts can weaken basket value
Fashion purchases are often complementary. A customer shopping for a complete outfit may abandon additional items when the central garment is unavailable.
For example, the retailer may lose not only the sale of a dress but also the potential sale of shoes, accessories, or outerwear selected to accompany it.
This effect is context-dependent and should not be assumed for every purchase. It is more relevant when products are merchandised as coordinated looks, uniforms, sets, or occasion-based solutions.
Emergency replenishment can consume the remaining margin
When a product sells faster than expected, teams may respond with expedited manufacturing, air freight, partial production runs, overtime, or fragmented supplier orders.
These actions can recover sales, but they may also introduce:
- Higher unit manufacturing cost
- Premium transportation charges
- Low-volume material purchasing
- Additional quality-control pressure
- Split deliveries
- Greater administrative workload
- Increased risk of arriving after demand peaks
A reorder is profitable only when the expected contribution from additional sales exceeds the full cost and risk of replenishment.
Fast sales alone do not make emergency production financially sound.
The Hidden Cost of the Wrong Size and Color Mix
The wrong inventory mix is one of the most common reasons a commercially promising fashion product underperforms financially.
A brand may correctly predict that a style will be popular but incorrectly distribute the quantity across colors and sizes. The result is a broken size range: core variants sell out, while less demanded variants remain.
This reduces profitability in several ways.
First, the brand misses potential full-price sales because customers cannot purchase the required size. Second, the remaining inventory becomes harder to sell because the assortment is incomplete. Third, the retailer may discount the entire style even though only certain variants are overstocked.
A blanket markdown can therefore reduce margin on variants that might still have sold at full price.
Size curves cannot be copied mechanically
A size curve is the planned distribution of units across the size range. It should reflect the garment category, fit, target customer, pattern construction, region, channel, and historical demand for comparable products.
The same size curve should not automatically be used for:
- Oversized and fitted silhouettes
- Womenswear and menswear
- Petite, tall, plus-size, and standard ranges
- Stretch and non-stretch garments
- Tailored and casual products
- Online and store-specific customer groups
- Different countries or regions
Past sales provide a useful starting point, but only when the previous product remained sufficiently available. Historical figures based on repeated stockouts may understate the true demand for popular sizes.
Color demand changes the economics of minimum orders
Suppliers may require a minimum order quantity per color, fabric, or production run. A brand that wants broad color choice may therefore commit more units than the total demand can support.
A six-color assortment can look attractive in product development but create shallow demand across too many variants. Production economics and customer choice must be balanced.
In some cases, fewer colors with stronger size availability may be more commercially effective than a broad palette with insufficient depth. In other market positions, color breadth is central to the brand proposition. The correct decision depends on customer expectations, supplier flexibility, price point, and the retailer’s ability to replenish winning colors.
How Excess Stock Restricts Cash Flow and Future Growth
Inventory is an asset, but it is also cash that has been converted into products and has not yet returned through customer sales.
A profitable fashion business can still experience cash-flow pressure when it purchases inventory too early, holds it too long, or pays suppliers well before collecting revenue.
Cash remains unavailable for better opportunities
Money committed to weak inventory cannot simultaneously be used for:
- Reordering a bestseller
- Launching a new collection
- Paying production deposits
- Funding marketing
- Improving product photography
- Hiring retail or fulfillment staff
- Investing in technology
- Paying operating expenses
- Negotiating more favorable supplier terms
This is the opportunity cost of stock. It is not always recognised as a direct expense, but it affects the company’s ability to respond to new demand.
A brand may identify a strong product opportunity and still be unable to act because too much cash remains locked in previous collections.
Purchasing commitments can create a cash-flow timing gap
Fashion brands frequently pay deposits before production and settle the remaining supplier balance before or soon after delivery. Revenue may arrive weeks or months later.
When the sales plan is inaccurate, the cash conversion period becomes longer than expected. The brand may need additional financing, delay new orders, or negotiate payment extensions.
Financing can support growth, but it adds cost and repayment obligations. Borrowing to fund inventory that sells slowly is different from financing inventory with predictable demand and controlled replenishment.
Overstock reduces buying flexibility
Good buyers need the ability to respond during the season. They may want to increase a winning category, test an emerging design direction, or redirect budget after early sales results.
When the purchasing budget is fully committed before demand becomes clear, the business loses that flexibility.
Open-to-buy discipline can help preserve purchasing capacity, but it only works when sales, receipts, inventory, cancellations, markdowns, and outstanding orders are updated accurately.
How Inventory Inaccuracy Creates False Profit Decisions
Inventory record inaccuracy occurs when system data does not match the identity, quantity, location, or status of physical stock.
It can lead to both excess inventory and lost sales. The system may recommend a reorder for stock that already exists, or display unavailable products to customers.
A widely cited empirical study examined almost 370,000 inventory records from 37 stores belonging to one retailer and found substantial inaccuracies in that particular dataset. The result demonstrates the scale the problem can reach, but it should not be treated as a universal retail benchmark. Empirical analysis of retail inventory record inaccuracy
Phantom inventory causes missed replenishment
Phantom inventory exists when the system shows more sellable stock than is physically available.
A replenishment rule may decide that no order is needed because the recorded quantity appears sufficient. Customers then encounter stockouts while management believes inventory remains on hand.
Possible causes include theft, receiving errors, unrecorded damages, incorrect transfers, picking mistakes, duplicate transactions, or returned units assigned to the wrong status.
Hidden inventory creates unnecessary purchasing
Hidden inventory is physically present but absent from the expected system record or location.
The buyer may reorder the product unnecessarily. The company then owns both the hidden units and the replacement order, increasing total exposure.
Hidden inventory can also arise when returns, samples, repair items, store transfers, or quarantined goods are not processed promptly.
False availability creates fulfillment costs
An online customer may successfully place an order for stock that does not exist. The retailer then spends time searching, communicating, canceling, refunding, and possibly offering compensation.
Even when the refund returns the transaction to zero revenue, the associated payment, customer service, labor, marketing, and reputational costs do not disappear.
Inventory accuracy is therefore not merely a warehouse performance indicator. It influences customer acquisition efficiency, fulfillment cost, replenishment quality, and trust.
How Returns Complicate Fashion Stock Profitability
Returns can turn a completed sale back into an inventory problem.
The retailer may need to refund the customer, inspect the product, replace packaging, clean or repair the garment, update the stock record, and determine whether the item can be resold at full price.
A 2025 report from the National Retail Federation and Happy Returns estimated that 19.3% of online sales in the United States would be returned that year. This is a survey-based U.S. retail estimate, not a universal global fashion return rate, but it illustrates why reverse logistics deserves explicit financial planning. 2025 Retail Returns Landscape
A returned unit may not recover its original margin
A returned garment may come back after the full-price selling period has weakened. It may also require repackaging, pressing, cleaning, repair, or quality inspection.
If the item can only be resold at a discount, the brand absorbs both the return-processing cost and the lower realised selling price.
Products that cannot be resold may require repair, outlet sale, supplier claim, donation, recycling, or write-off. The appropriate route depends on product condition, local regulations, logistics, economics, and the brand’s operational capabilities.
Poor stock planning amplifies return exposure
Overbuying does not directly cause customer returns, but it reduces the brand’s ability to absorb them.
If a retailer is already carrying excess stock, returned units add to the volume requiring resale. If the return arrives late in the season, the recovery options may be limited.
Weak product data can make the problem worse. Incorrect sizing guidance, inconsistent measurements, unclear fabric descriptions, and misleading product images can contribute to customer expectations not matching the received garment.
Inventory planning should therefore be coordinated with product quality, fit consistency, merchandising content, and return analysis.

A Simple Example of How More Revenue Can Produce Less Profit
The following hypothetical example illustrates why unit sales and revenue should not be reviewed without inventory investment and markdown depth.
Assume a fashion retailer sells one seasonal garment with:
- Full retail price: $50
- Unit cost: $20
- No additional expenses included in the example
- Remaining units eventually cleared at a reduced price
|
Outcome |
Controlled stock plan |
Poor stock plan |
|
Units purchased |
1,000 |
1,300 |
|
Inventory cost |
$20,000 |
$26,000 |
|
Units sold at $50 |
800 |
650 |
|
Full-price revenue |
$40,000 |
$32,500 |
|
Units sold at markdown price |
150 at $35 |
400 at $30 |
|
Markdown revenue |
$5,250 |
$12,000 |
|
Units cleared at $10 |
50 |
250 |
|
Clearance revenue |
$500 |
$2,500 |
|
Total revenue |
$45,750 |
$47,000 |
|
Gross profit before other costs |
$25,750 |
$21,000 |
The poor plan generates $1,250 more revenue but $4,750 less gross profit before considering storage, handling, marketing, returns, financing, or clearance administration.
Its gross margin rate is also lower:
- Controlled plan: approximately 56.3%
- Poor plan: approximately 44.7%
This example is deliberately simplified. Real retailers must also account for freight, duties, fulfillment, payment fees, returns, shrinkage, labor, occupancy, taxes, and other operating expenses.
The central lesson remains valid: selling more units or reporting higher revenue does not necessarily mean the inventory decision was more profitable.
The Main Profit-Leakage Pathways
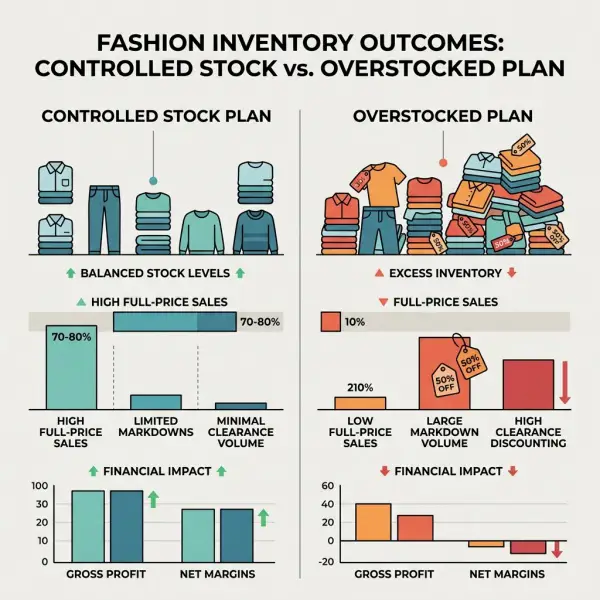
Poor stock planning affects profitability through several connected mechanisms.
|
Planning problem |
Immediate effect |
Profit consequence |
|
Excess total quantity |
Slow-moving and aging inventory |
Markdown, storage, handling, write-down, and clearance exposure |
|
Insufficient quantity |
Product stockout |
Lost gross margin and potential customer switching |
|
Wrong size curve |
Core sizes unavailable, fringe sizes remain |
Lost sales plus variant-specific overstock |
|
Wrong color mix |
Demand concentrated in fewer options |
Markdown pressure on weak colors |
|
Late delivery |
Reduced selling window |
Lower full-price opportunity and earlier discounting |
|
Early delivery |
Longer holding period |
Cash tied up before demand begins |
|
Poor store allocation |
Stock located away from demand |
Transfers, stockouts, and local markdowns |
|
Inaccurate inventory |
False availability or unnecessary reorders |
Cancellations, lost sales, and duplicated stock |
|
Weak return processing |
Sellable stock remains unavailable |
Delayed recovery and lower resale value |
|
Late markdown action |
Limited time to clear units |
Deeper discount or remaining obsolete inventory |
|
Excessive emergency replenishment |
Premium production and logistics |
Recovered revenue with reduced contribution |
|
Repeated blanket discounts |
Customers learn to wait |
Lower realised price and weakened pricing discipline |
These pathways often interact. A weak size curve can create stockouts and excess stock simultaneously. Inaccurate inventory can trigger unnecessary reorders. Late deliveries can force markdowns even when the original demand estimate was reasonable.
The planning problem should therefore be diagnosed as a system rather than assigned to one department.
How Repeated Discounting Can Change Customer Behaviour
Discounting can be commercially useful, but repeated predictable markdowns may encourage some customers to delay purchases in anticipation of a lower price.
Research into retail pricing has examined how strategic consumers respond when they expect markdowns and perceive that inventory may remain available. The most profitable pricing approach depends on demand, discount depth, inventory, and consumer behaviour rather than one universally superior policy. Research on markdown pricing and strategic consumers
For fashion brands, frequent broad discounting can create several commercial difficulties:
- Full-price customers may feel penalised for buying early.
- Future collections may be judged against expected sale prices.
- Wholesale partners may face conflict when direct channels discount aggressively.
- The brand may need higher initial prices to absorb expected markdowns.
- Product teams may misinterpret discount-driven sales as genuine demand.
This does not mean a brand should avoid all promotions. It means markdown timing, audience, product selection, and depth should support a defined inventory and pricing strategy.
Targeted action is often more precise than discounting the entire assortment. A retailer might intervene only in an overstocked color, selected location, customer segment, or aging product group.
How Poor Allocation Damages Otherwise Healthy Products
A product can be successful at company level and still create losses in individual locations.
One store may sell out rapidly while another holds excessive stock. If the retailer evaluates only total company performance, it may miss the need to transfer units or change future allocation.
Poor allocation causes:
- Lost full-price sales in high-demand locations
- Local markdowns in low-demand locations
- Additional transfer and handling costs
- Inaccurate store-level demand assumptions
- Weak visual presentation where size ranges become incomplete
- Customer frustration when company stock exists but is inaccessible
Omnichannel inventory can reduce some of these problems by allowing stores or warehouses to fulfill demand across channels. It also creates new operational requirements. Stock must be accurate, reservable, pickable, and available within the promised delivery time.
Inventory sharing without reliable system integration can increase order cancellations rather than improve availability.
Which Metrics Reveal Profitability Problems Early?
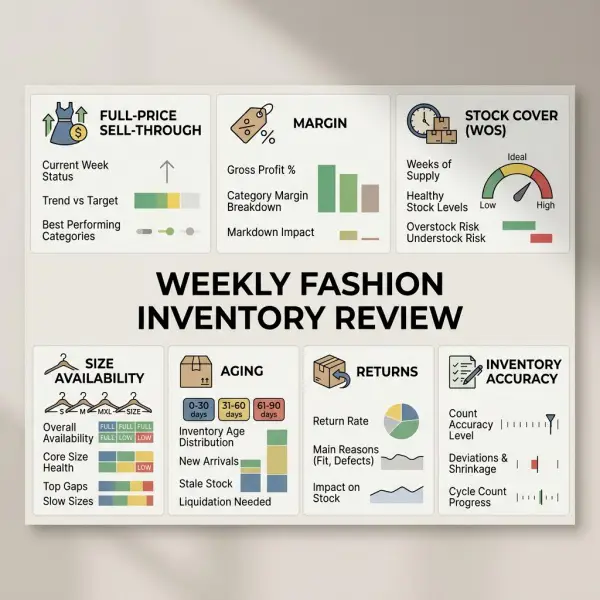
No single metric is enough. A high sell-through rate may look healthy if it was achieved through aggressive markdowns. Strong gross margin may look encouraging while the business holds large quantities of unsold stock.
A useful review combines sales, inventory, margin, time, and availability.
Full-price sell-through
Full-price sell-through shows how much inventory sold without markdown assistance.
This metric helps distinguish genuine product demand from clearance-driven unit movement. It should be reviewed by style, color, size, channel, and location where data volume allows.
Gross margin after markdowns
Initial margin is based on the planned retail price. Realised margin reflects what customers actually paid.
Management should monitor:
- Average realised selling price
- Markdown depth
- Percentage of units sold on promotion
- Gross margin by product and channel
- Margin remaining after returns where measurable
A product with impressive unit sales may contribute little profit if most transactions occur below the planned price.
Weeks of supply or stock cover
Stock cover estimates how long current inventory may last at a given sales rate.
It is useful for identifying potential shortages and overstock, but the calculation should account for seasonality and expected future demand. A product that sold strongly during launch week may not sustain the same velocity.
Size availability
Style-level availability can hide a broken size range.
Retailers should track whether commercially important sizes are available during the product’s main selling period. The ideal size profile depends on the category and customer, so a universal availability target is rarely appropriate.
Inventory aging
Aging reports show how long products have remained in inventory.
Age thresholds should reflect the product lifecycle. A permanent core product should not be assessed in the same way as a short seasonal capsule.
Stockout and lost-demand indicators
Potential lost demand can be estimated from:
- Product-page visits while unavailable
- Restock notification requests
- Unfulfilled store inquiries
- Search activity for unavailable SKUs
- Cart abandonment after availability changes
- Historical sales before the stockout
- Comparable-store or comparable-product demand
These indicators are estimates rather than completed sales. They should inform planning without being treated as guaranteed revenue.
Return and recovery metrics
Useful measurements include return rate, reason for return, time to inspection, percentage returned to full-price stock, repair rate, and value lost during the return cycle.
A high return rate may indicate product fit, quality, description, customer-selection, or channel problems. It should not be treated solely as an inventory issue.
A Practical Framework for Diagnosing Stock Problems
Fashion businesses can review inventory through four questions: demand, availability, economics, and time.
1. Is demand genuinely weak or merely constrained?
Determine whether low sales reflect low customer interest or limited availability.
Check whether important sizes were in stock, products were visible online and in stores, deliveries arrived on time, and marketing reached the intended audience.
Do not interpret low sales without reviewing availability.
2. Is the stock commercially usable?
Total units may include damaged goods, customer reservations, display pieces, returns awaiting inspection, incomplete sets, or inventory in inaccessible locations.
Planning should be based on sellable and operationally available stock, not only physical ownership.
3. Can the product still achieve an acceptable margin?
Estimate likely revenue under realistic future pricing.
Compare the expected margin from holding the product with alternatives such as transferring, promoting, bundling, marking down, repairing, or clearing it.
The objective is not always to preserve the original price. It is to choose the action that produces the best realistic recovery after considering time and cost.
4. How much selling time remains?
A product with six months of relevant demand has different options from one approaching the end of a short seasonal window.
Time influences whether the business should wait, replenish, transfer, promote, discount, or stop investing further resources.
This framework helps separate a temporary sales delay from structural overstock.
Common Stock-Planning Mistakes That Reduce Profit
Planning only from last year’s unit sales
Historical sales are valuable, but they need interpretation.
Last year’s demand may have been affected by stockouts, unusual promotions, competitor activity, weather, delivery timing, store closures, or a different price.
The better approach is to review sales together with availability, margin, launch conditions, product attributes, and external context.
Ordering extra units solely to obtain a lower unit cost
A supplier may offer a lower price at a higher quantity. The saving is useful only when the additional units can be sold at an acceptable margin.
For example, reducing the unit cost by $2 provides little benefit when the additional quantity later requires a $15 markdown.
The correct comparison is total expected profit and cash exposure, not unit cost alone.
Treating all stockouts as evidence of success
A stockout may indicate strong demand, but it may also indicate an initial buy that was too shallow, a failed replenishment process, incorrect allocation, or inaccurate records.
A product that sells out in one day is not automatically more profitable than one that sells steadily at full price over eight weeks. The brand must consider margin, demand duration, marketing cost, and the number of customers it could not serve.
Waiting until the season ends to review overstock
Late analysis reduces the range of available interventions.
Businesses should define review checkpoints before launch. Early indicators may include weaker-than-planned sales, rising stock cover, poor size balance, low product-page conversion, or strong return signals.
Applying the same markdown to every variant
A whole style may be discounted even though only one color or size group is overstocked.
Variant-level action can protect margin on products that remain commercially healthy. The practicality of selective markdowns depends on customer communication, store systems, merchandising, and price-consistency rules.





Comments 0
Leave a CommentSend Comment
Anda harus Login terlebih dahulu untuk dapat memberikan komentar.