

Virtual Try-On for Fashion Brands: When ROI Makes Sense and What Data You Actually Need
Introduction
Virtual Try-On (VTO) is no longer a novelty in fashion ecommerce—it is becoming a strategic lever for conversion, returns reduction, and customer confidence. As brands compete in increasingly crowded digital marketplaces, the ability to simulate fit, styling, and product experience remotely has direct implications on profitability.
However, despite its promise, many fashion brands struggle with a fundamental question: when does Virtual Try-On actually deliver ROI, and what level of data readiness is required to make it work?
This is not just a technology decision—it is a business model and data maturity decision. Brands that approach VTO without structured data or clear ROI thresholds often overspend with minimal impact. On the other hand, brands that align VTO with product categories, return rates, and customer behavior can unlock measurable gains.
This article provides a decision-oriented framework to evaluate when VTO makes financial sense and what data infrastructure is required to support it.
Quick Answer
Virtual Try-On delivers meaningful ROI when a fashion brand has (1) high return rates driven by fit uncertainty, (2) sufficient product data quality (accurate sizing, consistent imagery, or 3D assets), and (3) enough traffic volume to justify the technology investment. In most cases, ROI becomes viable for mid-to-large ecommerce brands or fast-growing DTC labels with monthly traffic above 50,000–100,000 sessions.
The most critical data requirements include structured size charts, standardized product photography, body or avatar mapping logic, and behavioral analytics (conversion, returns, engagement). Without this data foundation, VTO tools cannot generate reliable outputs, leading to poor user experience and low adoption.
Brands should not adopt VTO as a “trend feature,” but as a conversion optimization and returns reduction tool. The strongest ROI cases typically occur in categories like denim, fitted garments, footwear, and occasion wear—where fit uncertainty directly impacts purchase decisions.
What Virtual Try-On Actually Means in Fashion Commerce
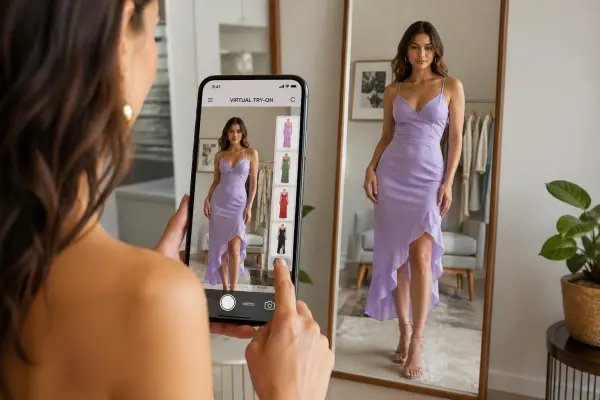
Virtual Try-On refers to a set of technologies that allow customers to visualize how a garment or accessory will look or fit on their body—either through augmented reality (AR), AI-based body mapping, or avatar maker simulation. While the concept sounds simple, there are several technical approaches behind it.
The most common VTO implementations include:
- 2D overlay (basic fit visualization)
- AR camera-based try-on (mobile-first experience)
- AI avatar-based simulation (input body measurements)
- 3D garment simulation (high-end, production-grade visualization)
From a business perspective, VTO sits at the intersection of product visualization, fit prediction, and personalization. Its primary role is to reduce uncertainty—one of the biggest barriers in online fashion purchasing.
For example, a denim brand selling globally may experience 25–40% return rates due to inconsistent sizing across regions. A VTO system that maps waist, hip, and inseam measurements can significantly reduce this friction.
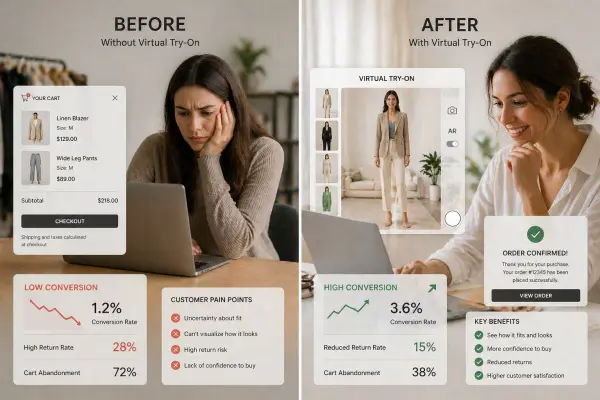
The key insight here is that VTO is not about visual gimmicks—it is about decision confidence. The more accurate and relevant the simulation, the higher the probability of conversion and the lower the likelihood of returns.
Takeaway: Virtual Try-On is fundamentally a decision-support tool, not just a visual feature.
When Does ROI from Virtual Try-On Make Sense?
ROI from VTO depends on three core variables: traffic volume, return rate, and product fit sensitivity. Without alignment across these factors, even the best technology will struggle to justify its cost.
First, traffic volume matters. If a brand has fewer than 20,000 monthly visitors, the impact of VTO will be statistically limited. ROI improves significantly when brands operate at scale, where even a 2–3% conversion uplift translates into meaningful revenue.
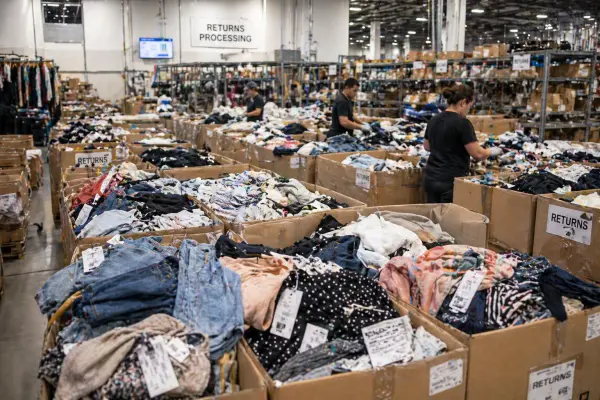
Second, return rate is a critical driver. Categories like tailored garments, denim, dresses, and footwear often have high return rates due to fit uncertainty. If returns exceed 20–30%, VTO can directly reduce operational costs.
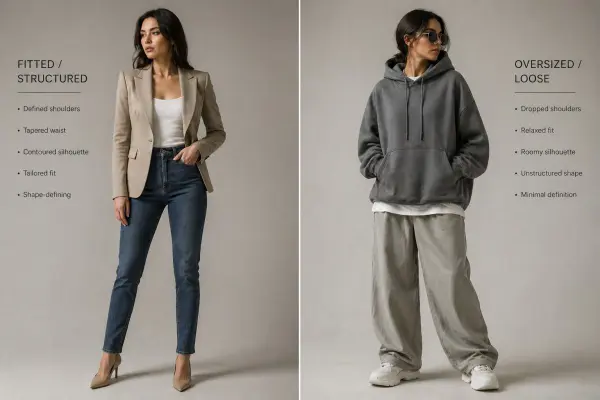
Third, product complexity plays a role. Loose-fit garments (e.g., oversized hoodies) benefit less from VTO compared to structured garments (e.g., blazers, jeans). The tighter the fit requirement, the higher the ROI potential.
A practical example:
A DTC dress brand with:
- 100,000 monthly visitors
- 2.5% conversion rate
- 30% return rate
Even a modest improvement (e.g., +10% conversion lift or -5% returns) can generate a strong ROI within 6–12 months.
Takeaway: VTO ROI becomes viable when scale, fit complexity, and return costs intersect.
What Data Is Required to Make Virtual Try-On Work
The biggest misconception is that VTO is a plug-and-play solution. In reality, it is heavily dependent on data quality and consistency.
At minimum, brands need structured product data, including:
- Accurate size charts (standardized across SKUs)
- Garment measurements (not just S/M/L labels)
- Fabric behavior (stretch, drape, rigidity)
Beyond product data, visual consistency is essential. Product images must follow standardized angles, lighting, and proportions. Inconsistent photography reduces the accuracy of overlay or simulation models.

More advanced implementations require:
- 3D garment models
- Body measurement datasets
- Customer input data (height, weight, body shape)
- Historical fit feedback (returns, reviews)
For example, a global footwear brand using VTO may combine:
- Foot scanning via mobile camera
- SKU-specific fit data
- Historical return patterns
This allows the system to recommend not just visualization, but correct size selection.
Without this data infrastructure, VTO becomes unreliable—and unreliable outputs damage user trust.
Takeaway: Data readiness is the primary determinant of VTO success—not the technology itself.
Cost Structure and Investment Considerations
Implementing VTO involves multiple cost layers, not just software licensing.
Typical cost components include:
- Technology licensing (SaaS or API-based)
- Integration with ecommerce platform
- Data preparation (size charts, assets, 3D models)
- Ongoing optimization and maintenance
Entry-level VTO solutions may cost a few thousand dollars annually, while advanced 3D simulation systems can require six-figure investments.

However, ROI should not be evaluated purely on cost—it should be measured against:
- Conversion uplift
- Return reduction
- Customer lifetime value (CLV)
- Reduced customer support costs
For example, a brand reducing return rates from 30% to 25% can save significant logistics and reverse supply chain costs, especially in cross-border ecommerce.
Another often overlooked factor is customer experience differentiation. Brands using VTO effectively can position themselves as more innovative and customer-centric, which indirectly impacts brand equity.
Takeaway: VTO should be evaluated as a multi-layer investment tied to both revenue growth and cost efficiency.
Risks, Limitations, and When Not to Use VTO
Despite its advantages, VTO is not universally beneficial. There are clear scenarios where it may not deliver ROI.
One major risk is low adoption. If customers do not trust or use the feature, the investment becomes sunk cost. Poor UX design or inaccurate outputs often lead to this issue.
Another limitation is data inconsistency. Brands with fragmented sizing systems or inconsistent product photography will struggle to generate accurate simulations.
VTO is also less effective for:
- Loose or forgiving silhouettes
- Low-margin products
- Brands with limited SKU depth
For example, a fast-fashion brand with constantly changing collections may find it difficult to maintain the data consistency required for VTO.
Additionally, there is a risk of overpromising accuracy. If customers rely on VTO and still experience poor fit, trust erosion can be worse than not having the feature at all.
Takeaway: VTO should be avoided when data is weak, margins are low, or product fit is not a key decision factor.
Comparison Table: When to Invest in Virtual Try-On
|
Factor |
Low Readiness (Avoid) |
Medium Readiness (Test) |
High Readiness (Invest) |
|
Traffic Volume |
<20K/month |
20K–80K/month |
>80K/month |
|
Return Rate |
<10% |
10–20% |
>20% |
|
Product Type |
Loose fit |
Mixed categories |
Fit-sensitive |
|
Data Quality |
Inconsistent |
Partial standardization |
Fully structured |
|
Budget |
Limited |
Moderate |
Strategic investment |
|
Expected ROI |
Low |
Uncertain |
High |
Practical Application for Fashion Brands
To implement VTO effectively, brands should follow a staged approach.
Start with data standardization. Clean up size charts, ensure consistent product measurements, and align photography standards. This alone can improve conversion before VTO is introduced.
Next, run a pilot program on a high-impact category—such as denim or dresses. Measure key metrics including conversion rate, engagement time, and return rate.
Then, integrate VTO with customer data inputs. Allow users to input body measurements or preferences to improve accuracy.

Finally, scale gradually based on performance data, rather than rolling out across all categories at once.
Common Mistakes to Avoid
One common mistake is treating VTO as a marketing gimmick rather than a performance tool. This leads to poor integration and low ROI.
Another mistake is skipping data preparation. Without structured sizing and consistent imagery, VTO outputs will be inaccurate.
Brands also often underestimate adoption challenges. If the feature is not intuitive or clearly valuable, customers will ignore it.
Lastly, over-investing too early without testing ROI assumptions can strain budgets—especially for startups.
FAQ
1. Is Virtual Try-On suitable for small fashion brands?
It depends on traffic and category. Small brands with low traffic may not see immediate ROI. However, niche brands with high-value products and fit sensitivity can benefit from targeted VTO implementation.
2. How much does Virtual Try-On cost?
Costs vary widely—from a few thousand dollars annually for basic tools to six-figure investments for advanced 3D simulation systems. ROI should be evaluated against conversion and return improvements.
3. What data is most important for VTO?
Accurate size charts, garment measurements, and consistent product imagery are essential. Advanced systems also require body data and historical fit insights.
4. Does VTO reduce returns?
Yes, when implemented correctly. It reduces fit uncertainty, which is a major driver of returns—especially in structured garments.
5. Which product categories benefit most from VTO?
Denim, dresses, tailored garments, and footwear see the highest impact due to fit sensitivity.
6. How long does it take to see ROI?
Typically 6–12 months, depending on traffic volume, implementation quality, and adoption rate.
Conclusion
Virtual Try-On is not a universal solution—it is a strategic tool that works under specific conditions. The brands that succeed with VTO are not necessarily the most technologically advanced, but the most disciplined in data and decision-making.
ROI emerges when VTO is aligned with high-impact categories, supported by strong data infrastructure, and deployed with clear performance metrics. Without these elements, it becomes an expensive experiment.
The real competitive advantage lies not in adopting VTO early, but in implementing it correctly and scaling it intelligently.





Comments 0
Leave a CommentSend Comment
Anda harus Login terlebih dahulu untuk dapat memberikan komentar.